Porter Five Forces
Industry structure explains a quarter to a third of profit variance, but no located study tests whether running a five forces analysis improves a decision.
- Published
- Source
- Michael Porter
- Evidence
- Observational evidence
- Reading time
- 17 min

Short summary
Porter’s five forces is a structural read of a defined industry: threat of new entrants, bargaining power of suppliers, bargaining power of buyers, pressure from substitutes, and rivalry among existing competitors. The claim is that the collective strength of these five sets the industry’s profit potential, so a company should position itself where the forces are weakest, or act to change them. It is offered as an aid to decisions about entry, diversification, which buyers to sell to and which suppliers to buy from, and where a strategic move will pay off. The 1979 article supports this with industrial-economics reasoning and roughly thirty short industry illustrations rather than measured outcomes. Later peer-reviewed work tests the underlying premise that industry membership explains part of profitability, and applies the framework in case settings.
1. Framework origin
Michael E. Porter published How Competitive Forces Shape Strategy in Harvard Business Review in March-April 1979 (Reprint 79208; the reprint carries a July-August 1997 header). The supplied HBS faculty page returned a 403 when checked, so whether that page holds the 1979 text or Porter’s 2008 restatement needs verification.
Porter was then an associate professor of business administration at Harvard Business School, working in industrial economics and business strategy, and had created a course there called “Industry and Competitive Analysis”. His 1976 book, Interbrand Choice, Strategy and Bilateral Market Power, grew out of his doctoral thesis. The lineage matters for reading the framework: it is industrial-organisation economics, where market structure is treated as the thing that sets the available returns, translated into language a manager can use on a Tuesday.
The diagram is the whole argument in one picture.
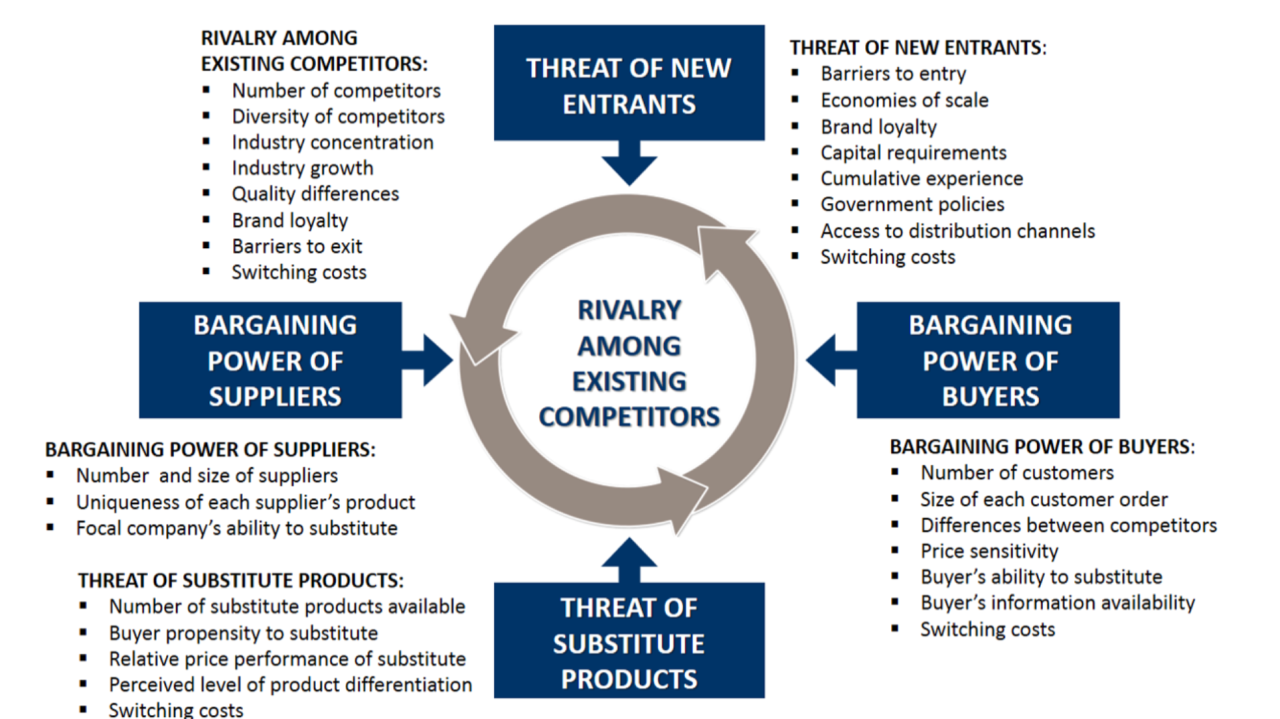
Four forces point inward at a central circle labelled rivalry, each unpacked into determinants such as economies of scale, switching costs, brand loyalty, buyer concentration and price sensitivity. There are no weights, no scores and no measured outcomes. It is a map of proposed causes, which tells you what the framework is for and what it cannot do on its own.
2. Decision it claims to improve
Two decisions, mainly. The first is whether an industry is worth being in at all. Porter presents the framework as a way to answer “What is the potential of this business?” when setting diversification strategy, and to forecast eventual profitability for long-range planning, with the caution that doing so requires judgment in its application and that the forecast “may differ a great deal from the existing industry structure”.
The second is where to stand inside an industry you have already chosen. That covers which buyer segments to sell to and which suppliers to buy from, which force to confront and which to avoid, and where a structural move such as raising switching costs, differentiating, or integrating vertically would change the economics rather than just the quarter. Porter’s three stated approaches are positioning against the forces, influencing their balance, and anticipating shifts in the factors underlying them.
3. Evidence base
The 1979 article is reasoning plus illustration. The central claim, that the collective strength of the five forces determines industry profit potential, is asserted rather than measured. Profit differences are described: forces are said to be intense in tires, metal cans and steel, where no company earns spectacular returns, and mild in oil field services and equipment, soft drinks and toiletries, where there is room for quite high returns. No figures accompany that classification.
Dr Pepper is the fullest worked case and carries the only firm-level number: a 6% share of the $11.5 billion soft drink industry, achieved by avoiding the largest-selling segment, keeping a narrow flavour line, piggybacking on Coke and Pepsi bottlers and marketing heavily, with a formula that had lower raw materials cost. The outcome, “an enviable record in earnings and in the stock market”, is asserted and not quantified, and the case cannot separate positioning from execution or from that cost advantage. Around thirty further examples do similar work: Timex building its own distribution channels in watches in the 1950s, Polaroid’s patent expiry preceding Kodak’s entry, fiberglass insulation producers in 1978 facing cellulose, rock wool and styrofoam, recreational vehicles losing their high returns after the early 1970s boom. Each was chosen because it already fitted the mechanism. That is coherent theory with case illustration, not a test of it.
The article is also clear about several of its own limits. Porter argues the experience curve is a shaky foundation: where cost falls come from generally known technical advances or purchasable equipment, “the experience curve is no entry barrier at all”, and less experienced competitors may enjoy a cost advantage over the leaders. He states that a company must live with many structural factors because they are built into industry economics, that some industries do not enjoy the luxury of selecting “good” buyers, and that the proper definition of a company’s industry is “an endlessly debated subject”.
Other perspectives
Porter restated the framework in The Five Competitive Forces That Shape Strategy (Harvard Business Review, 2008), arguing that competition for profits goes beyond established rivals and that awareness of the forces helps a company stake out a position that is more profitable and less vulnerable to attack. That is theory-level support, not new evidence.
The strongest independent evidence addresses the premise rather than the framework. Zhou and Park, in Decomposing Firm Performance in Emerging Markets (Management and Organization Review, 2024), replicate the US variance decomposition for 1981-1994 and report, for profit, an industry effect of 29.07%, segment effect of 27.46%, corporate effect of 11.44% and year effect of 9.21%, with the segment effect falling to 18.68% for sales growth (p<0.000). For China between 1995 and 2012, across 2,554,996 observations from 523,172 firms, they report a firm effect of 15.78% and an industry effect of 21.43% for profit, with the firm effect for growth at 10.36%. Across their global sample, the firm effect explains 28.99% of profit variance in OECD countries against 15.11% in non-OECD countries. This is observational variance decomposition: it shows industry membership is associated with a substantial share of profit differences, not that the five forces are the mechanism.
Shi, Agbaku and Zhang, in How Do Upper Echelons Perceive Porter’s Five Forces? (Frontiers in Psychology, 2021), interviewed 22 entrepreneurs and surveyed managers for 156 valid responses. They report that 78.2% agreed the five forces are used to measure competition intensity, attractiveness and profitability while 21.8% disagreed, with factors explaining 60.34% of variance for substitutes, 62.136% for buyers, 58.445% for suppliers and 61.364% for rivalry. They also identify three further forces in the Chinese setting: guanxi, technology, and marketing and branding. That measures perception and factor structure, not decision quality.
Lethbridge, in Understanding multinational companies in public health systems (Globalization and Health, 2011), applied the forces to five multinational healthcare companies using ten key informant interviews and document analysis, concluding the framework is useful for identifying factors public health systems need to understand as commissioners, while finding EU competition policy, government regulation and political risk management shaping strategy from outside the five. Isabelle, Horak, McKinnon and Palumbo, in Is Porter’s Five Forces Framework Still Relevant? (TIM Review, 2020), compare mining and IT and argue the original framework is too static, proposing four additions: digitalisation, competitors’ level of innovativeness, globalisation and exposure to de/regulation. The Wikipedia summary records Brandenburger and Nalebuff’s complementors as a proposed sixth force, Tony Grundy’s objection that the model offers no actionable guidance on managing a high or low force, and Coyne and Subramaniam’s point that it assumes arm’s-length, non-colluding players and low enough uncertainty to plan against. Those attributions are arguments rather than findings and should be checked against the primary sources. From practice, Paul Millerd at StrategyU argues the value is the quality of thinking produced rather than the completed template, advising a narrow industry definition and a focus on the one or two forces that actually drive profitability.
Nothing I could open tests whether running a five forces analysis improves a decision. There is no controlled or matched comparison of teams that ran one against teams that did not, and no study linking the analysis to subsequent entry, exit, pricing or investment outcomes. A 2017 Academy of Management Proceedings paper by Greiner and co-authors, “An Empirical Test of the Five Forces Model”, reportedly finds no support for the hypothesised relationships using Porter’s own suggested measures; it could not be opened, so that finding needs verification before anyone leans on it.
4. Where it helps
The widening of attention holds up. Managers who track only direct rivals miss that they are simultaneously bargaining against customers and suppliers and competing against substitutes. Every source reviewed here, including the critical ones, accepts that framing, and Porter’s own line is still the useful one: many managers concentrate so single-mindedly on direct antagonists that they fail to realise they are also competing with their customers and suppliers for bargaining power.
The structural premise is supported, within limits. Zhou and Park’s decomposition is consistent with industry membership explaining a meaningful share of profit variance, which makes “this industry cannot support the returns in our model” a legitimate conclusion rather than an excuse from a weak team.
It bites hardest before capital is committed. On the timescale of an entry, acquisition or diversification decision, the forces are largely fixed, which is exactly Porter’s deflating point that a company must live with many of these factors with only some latitude for improving matters. That is a useful thing to put in front of an acquirer whose case rests on execution.
Buyer selection is the most operational part of the article. The rule that you can sell to powerful buyers and still earn above-average profitability only if you are a low-cost producer or your product has unusual features converts an aspiration into a test, and National Can and Crown Cork & Seal illustrate the uncomfortable move that follows: turning business away. The experience-curve insert is the sharpest reasoning in the piece and the least quoted. If your cost advantage comes from scale or equipment anyone can buy, it is not a barrier, and a newer entrant with a newer plant may beat you on cost.
5. Where it misleads
The framework diagnoses attractiveness and says little about what to do next. The three approaches are directions, not decision rules, and Grundy’s objection that there is no actionable guidance on managing a high or low force is fair on the text as written. Exit barriers are deferred to a separate 1976 article, and the experience curve gets an explicit “space does not permit a complete treatment here”.
Industry definition does most of the work and is left open. Change the boundary and the forces change, so the same business can be declared attractive or hostile depending on where the line is drawn. Porter names the debate and leaves it unresolved; Millerd identifies it as where the analysis most often goes wrong in practice; and nothing located studies how practitioners actually draw it. That is a large degree of freedom sitting underneath an apparently objective output.
The structural premise is partial rather than dominant. In Zhou and Park’s US decomposition the segment effect of 27.46% sits close to the industry effect of 29.07%, and the firm effect explains 28.99% of profit variance in OECD countries. Treating structure as the explanation of profitability overstates what the data supports, which is the substance of the resource-based objection that industry attractiveness cannot be judged independently of firm resources. Note also the Chinese firm effect for growth of 10.36%: this is a framework about margins, and managers frequently ask it about growth.
The omissions recur but do not agree. Lethbridge found regulation and political risk operating outside the five. Isabelle and colleagues add digitalisation, innovativeness, globalisation and de/regulation. Shi and colleagues add guanxi, technology, and marketing and branding. Brandenburger and Nalebuff add complementors. Everyone finds something missing and nobody finds the same thing, which argues for treating the five as a checklist opener rather than a closed list. Regulation is the clearest case: it appears inside the model only as an entry barrier, which badly understates it in healthcare and other regulated sectors.
Finally, the framework assumes a structure stable enough to position against. In young or fast-reconfiguring industries that assumption weakens, and approaches built around how components evolve, such as Wardley Mapping, are asking a different question. Porter’s forward-looking example, the solar heating business with dozens and perhaps hundreds of companies, demonstrates the method rather than validating it. Every other example in the article was selected after the outcome was known, which makes the piece a good explanation of settled results and weak support for the one use that matters most: deciding on an entry that has not happened yet.
6. Scorecard
| Dimension | Score | Rationale |
|---|---|---|
| Clarity | 9/10 | Five named forces, each broken into concrete sources (the article lists six major sources of barriers to entry) and illustrated with recognisable industries, so a team can learn and apply the vocabulary quickly. The one genuinely unclear element is the unit of analysis: Porter calls the proper definition of a company’s industry “an endlessly debated subject” and leaves it unresolved. |
| Novelty | 5/10 | It is a disciplined translation of industrial-organisation economics into a manager’s checklist rather than a new theory; Porter’s own background is industrial economics, and his 1976 book Interbrand Choice, Strategy and Bilateral Market Power came from his doctoral thesis on bilateral market power. Novel in 1979 as a repackaging for practitioners, and the experience-curve critique inside the article was the sharper original contribution. |
| Evidence base | 4/10 | The 1979 article asserts the core claim without data and supports it with roughly thirty retrospective illustrations; the only firm-level number is Dr Pepper’s 6% share of an $11.5 billion soft drink industry, with the “enviable record in earnings” left unquantified. External support is thin for the framework and moderate for its premise: Zhou and Park (2024) report industry effects of 29.07% (US profit, 1981-1994) and 21.43% (China, 2,554,996 observations), while Shi, Agbaku and Zhang (2021, 156 valid responses) measure perceptions rather than outcomes. |
| Causal strength | 5/10 | The strongest located evidence is observational variance decomposition (Zhou and Park, 2024), which shows industry membership is associated with a real but partial share of profit variance (29.07% industry against 27.46% segment for US profit) without establishing that the five forces are the mechanism. The article’s own evidence is case illustration selected after outcomes were known, and a reported 2017 Academy of Management Proceedings test by Greiner and colleagues finding no support could not be opened and needs verification. |
| Decision usefulness | 6/10 | It bites hardest on entry, acquisition and diversification decisions, where structure is fixed on the timescale of the choice, and the buyer-power rule is operational: sell profitably to concentrated buyers only if you are the low-cost producer or have unusual product features, illustrated by Emerson Electric and by National Can and Crown Cork & Seal turning away segments. It diagnoses attractiveness without telling you what to do about a high force, the objection attributed to Tony Grundy, and no located study links running the analysis to better entry, pricing or investment outcomes. |
| Practicality | 6/10 | A small team can complete it in a workshop from public data, and Lethbridge (2011) applied it to five multinational healthcare companies using ten informant interviews and document analysis. The practical cost is that the result moves with the industry boundary, which Millerd (StrategyU, practitioner assertion) identifies as where the analysis most often goes wrong, and nothing located studies how practitioners actually draw that line. |
| Risk of misuse | 8/10 | Five boxes with no scoring rules invites colour-coded theatre and post-hoc justification of a decision already made, and the boundary ambiguity lets the same industry be declared attractive or hostile depending on where the line falls. Overreach is easy on the numbers too: with the US segment effect at 27.46% against an industry effect of 29.07%, and the firm effect explaining 28.99% of profit variance in OECD countries, treating structure as the explanation of profitability overstates what the decomposition supports, and the Chinese firm effect for growth of 10.36% is a reminder it speaks to margins rather than growth. |
| Overall usefulness | 6/10 | Worth using as a structured pre-mortem before capital is committed, because the premise that industry structure matters is supported observationally and the framework reliably widens attention from rivals to buyers, suppliers, entrants and substitutes. It earns no more than that: the 1979 support is retrospective illustration, nothing located tests whether the analysis improves a decision, and the omissions found in practice differ by setting (regulation and political risk in Lethbridge; digitalisation and de/regulation in Isabelle and colleagues; guanxi in Shi and colleagues), so treat the five as a checklist opener rather than a closed list. |
Risk of misuse: a higher score means higher risk.
A 6 reflects a framework whose premise is better supported than its practice. The underlying economics are sound and the vocabulary is genuinely useful, but the original evidence is retrospective illustration, the strongest independent work tests industry effects rather than the framework itself, and nothing located shows that running the analysis produces better decisions. The low causal and evidence scores pull against high clarity, and the risk-of-misuse score is the one to watch: five boxes without scoring rules, sitting on an undefined industry boundary, is an efficient way to dress up a decision already made.
7. Practical use case
A medical device business is weighing entry into Australian point-of-care diagnostics. Run the five forces as a structural pre-mortem before the business case is written, and force each force to a number or a named fact rather than a traffic light. Buyer power: how concentrated are the purchasers, public hospital networks or private pathology chains, and what fraction of their cost does the device represent. Supplier power: is there a single reagent or sensor supplier, and what are the switching costs. Substitutes: what does the current laboratory pathway cost per test, and which way is that trending. Entry: what do regulatory approval and a distribution agreement actually cost, and is that barrier rising or falling. Rivalry: are competitors adding capacity in large increments.
Then apply Porter’s own buyer test to the segment you intend to sell to. If the purchasers are concentrated chains, above-average returns require either a low-cost position or features competitors cannot match. If neither is true, the right output is a narrower segment or a decision not to enter, not a larger sales target.
Two adjustments for this setting. Treat regulation and reimbursement as forces in their own right rather than entry barriers, since Lethbridge found policy and political risk shaping healthcare company strategy from outside the five, and in Australia a reimbursement decision usually matters more than rivalry. And write down the industry boundary you assumed, because the result moves with it. The analysis earns better questions and a check on optimistic margin assumptions. It is not evidence that the entry will work.
Key questions
Does Porter’s five forces actually work?
No located study tests whether using the five forces improves a decision. There is no controlled or matched comparison of teams that ran an analysis against teams that did not, and nothing linking the analysis to subsequent entry, exit, pricing or investment outcomes. What is supported is the premise underneath it: Zhou and Park (Management and Organization Review, 2024) report an industry effect of 29.07% of profit variance for US firms in 1981-1994 and 21.43% in China across 2,554,996 observations, which is observational evidence that industry structure matters without showing the five forces are the mechanism. Treat it as a reasoning prompt with a defensible economic basis, not a validated model.
What evidence did Porter provide in the original article?
Economic reasoning plus roughly thirty retrospective industry illustrations. The core claim, that the collective strength of the five forces determines industry profit potential, is asserted without data, and the comparison of intense industries (tires, metal cans, steel) with mild ones (oil field services and equipment, soft drinks, toiletries) carries no figures. The only firm-level number is Dr Pepper’s 6% share of the $11.5 billion soft drink industry, with its earnings and share-price outcome described but not quantified. Every example was selected after the result was known, so the article explains outcomes well and tells us little about accuracy applied forward.
What are the main limitations of the five forces framework?
Three stand out. The industry boundary determines the answer and Porter leaves its definition as “an endlessly debated subject”, so the same business can be judged attractive or hostile depending on where the line falls. The framework diagnoses attractiveness without saying what to do about a high force, an objection attributed to Tony Grundy. And the omissions are real but inconsistent: Lethbridge (2011) found regulation and political risk operating outside the five in healthcare, Isabelle and colleagues (2020) propose digitalisation and de/regulation, Shi and colleagues (2021) propose guanxi, which suggests using the five as a checklist opener rather than a closed list.
When should you use Porter’s five forces?
Before capital is committed, on entry, acquisition and diversification decisions, where the structure is effectively fixed on the timescale of the choice and a plan built on execution confidence most needs a reality check. It is also directly useful for buyer selection, where Porter’s rule is testable: you can sell profitably to powerful buyers only if you are the low-cost producer or your product has unusual features. It is weaker in young or rapidly reconfiguring industries, where there is not yet a stable structure to position against. Define the industry narrowly, identify the one or two forces that actually drive returns, and write down the boundary you assumed.
References
- How Competitive Forces Shape Strategy, Michael Porter
- The Five Competitive Forces That Shape Strategy, Michael E. Porter, Harvard Business Review, 2008
- Is Porter’s Five Forces Framework Still Relevant? A study of the capital/labour intensity continuum via mining and IT industries, Isabelle, Horak, McKinnon & Palumbo, Technology Innovation Management Review, 2020
- How Do Upper Echelons Perceive Porter’s Five Forces? Evidence From Strategic Entrepreneurship in China, Shi, Agbaku & Zhang, Frontiers in Psychology, 2021
- Decomposing Firm Performance in Emerging Markets: The Difference Between Growth and Profit, Zhou & Park, Management and Organization Review, 2024
- Understanding multinational companies in public health systems, using a competitive advantage framework, Lethbridge, Globalization and Health, 2011
- Porter’s five forces: a practical guide for actually using the framework, Paul Millerd, StrategyU, 2026
- Porter’s five forces analysis, Wikipedia
Source. How Competitive Forces Shape Strategy, Michael Porter.