BCG C-Curve
BCG's C-curve says fix returns before chasing growth. The evidence is a 60-company retrospective screen, so treat it as a portfolio prompt, not proof.
- Published
- Source
- Boston Consulting Group
- Evidence
- Observational evidence
- Reading time
- 14 min
Short summary
BCG’s C-curve is a sequencing rule for businesses that have earned below their cost of capital for years: deliberately shrink the capital base to the most advantaged and profitable core, improve margins to lift returns, and only then pursue growth. The evidence behind it is a retrospective screen of the S&P 1500 that ends with 60 low-ROCE companies, among which BCG studied the strongest total shareholder return performers and found a shared three-step pattern. That design identifies the winners first, so it can describe what outperformers had in common but cannot show that the sequence produced the outperformance. The most defensible finding in the article is a different one: a company’s starting ROCE position tells you very little about its subsequent five-year TSR. The practical value of the C-curve is as a portfolio diagnostic and a check on growth-led turnaround plans, not as a demonstrated recipe for value creation.
1. Framework origin
Boston Consulting Group, published under its corporate finance and strategy publications. The publication URL indicates 2025, though no publication date appears in the text provided. The source describes the work as a new BCG analysis and is explicit that the framing is new rather than the idea: it presents the C-curve as a new empirical framing of a corporate-strategy tenet BCG has long championed, which is to build advantage, increase returns, then pursue growth, in that order.
No individual authors are named in the material provided. The article credits the BCG ValueScience team for research support and contributions, naming Aidan Nguyen, Mike Kuldanek and Brett Schiedermayer.
Two things follow from the origin. First, the novelty claim sits with the dataset, not the logic, and BCG says so itself. Second, this is consultancy thought leadership attached to a practice that sells portfolio and capital allocation work. That is a reason to read the method section closely rather than a reason to dismiss the analysis, and to BCG’s credit the method section is there and discloses its exclusions.
2. Decision it claims to improve
The decision is what to do with a division that has earned below its cost of capital for years and is asking for growth capital. The realistic options are to fund the expansion, hold the unit flat and keep waiting, or deliberately shrink its footprint and capital base first and defer growth investment until returns clear the cost of capital. The C-curve argues for the third, and argues for it as a sequence rather than a set of parallel initiatives.
A second, narrower decision sits underneath it: whether to approve a turnaround plan that forecasts improved returns without any change in scope, segments or served customers. The source’s own diagnostic puts this well, asking what evidence or rationale supports confidence in a turnaround when returns are expected to improve with no meaningful strategic shift. That is a governance question, it is cheap to ask, and most capital committees do not ask it systematically.
The framework also changes the measurement regime for low-return units, moving the primary objective from P&L growth to cash flow and returns. Changing the metric changes which options look attractive, which is what separates a useful framework from a maxim.
3. Evidence base
Retrospective observational analysis of listed-company data, with no control group, no matching and no counterfactual. BCG began with more than 2,300 companies from the S&P 1500 Index covering 2014 through 2024. It excluded companies with insufficient data, financial institutions, companies with extreme capital intensity, businesses experiencing temporary downturns caused by normal cyclical fluctuations, and small early-stage high-growth companies whose low returns were primarily due to growth-related investments. The remaining 668 companies were screened for ROCE below 4%, with ROCE calculated as net operating profit after taxes divided by capital employed, excluding goodwill and intangibles. That produced a sample of 60 companies. TSR was then assessed from 31 December 2019 through 31 December 2024, comparing the top quartile, being the top 15 performers, with the bottom quartile, being the bottom 15.
Two findings in the article sit at very different evidence grades, and it is worth separating them.
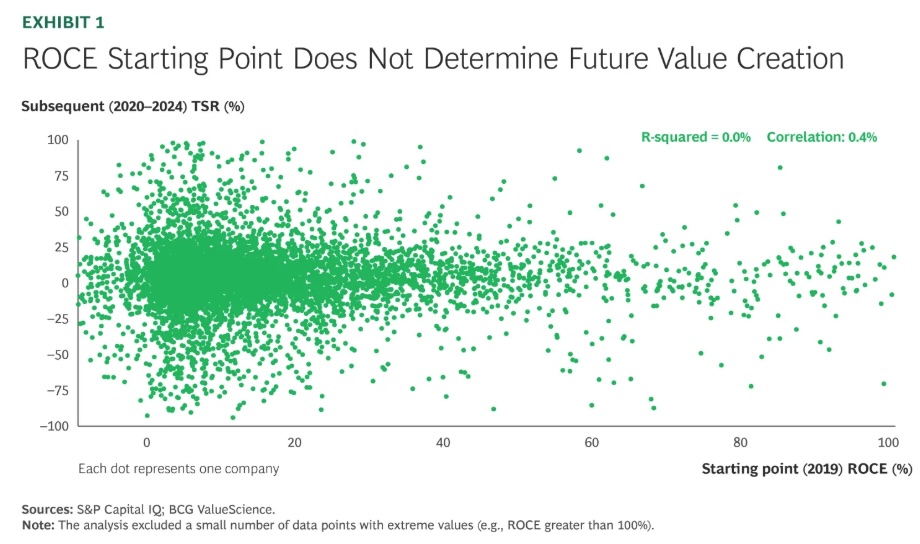
The first is the cross-sectional result in Exhibit 1: companies starting from very different positions delivered, on average, similar five-year TSR, and the odds of delivering top-quartile TSR were about the same for either group. This is a descriptive observation, and it is consistent with the source’s own explanation that the starting position is already priced into the valuation, so outperformance depends on beating priced-in expectations rather than on the absolute level of current returns. The inference is sound and does not overreach.
The exhibit behind this finding is a scatter of individual companies rather than a comparison of grouped averages, and the fit statistics are reported on the chart: R-squared of 0.0% and correlation of 0.4%. What it shows is an absence of any linear relationship between where a company started on ROCE and what its shareholders earned over the next five years. What it does not show is why, since a null correlation is consistent with the pricing explanation BCG offers and with several others.
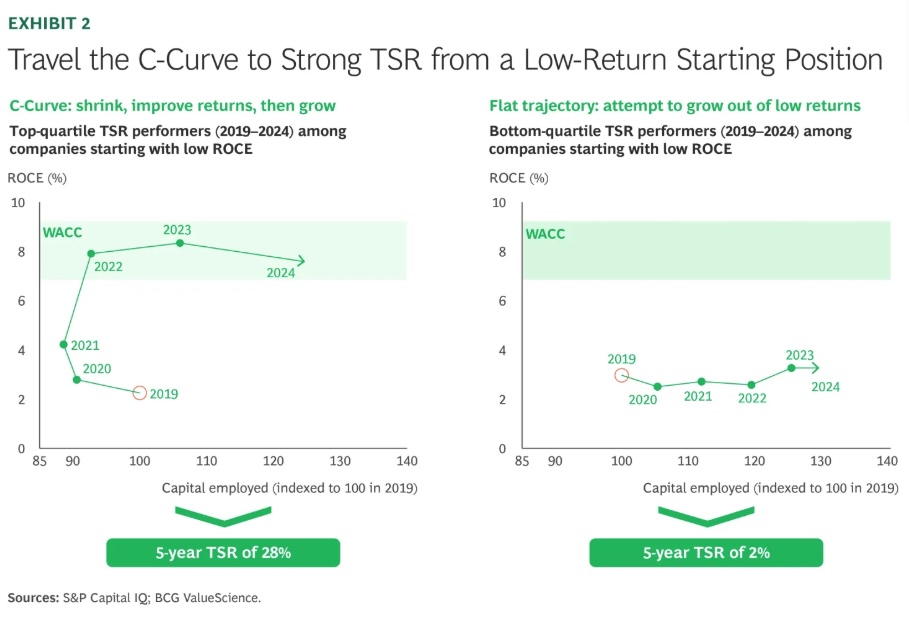
The second finding is the C-curve itself, and it is weaker. BCG identified the TSR winners within the low-return group and then observed a shared three-step pattern among them. That is selection on the dependent variable. Companies that shrank their capital base and still underperformed are not visible in the design, so the base rate of the strategy is unknown. The headline figure, 28% TSR from 2019 through 2024 for companies that travelled the C-curve, placing them in the top decile of performers in the broader market, is an aggregate for a group defined after the outcome was known, and the size of that group is not disclosed. The failure case is stated in hedged terms: companies that attempted to grow their way out of a low-return starting position tended to generate little, if any, value for shareholders.
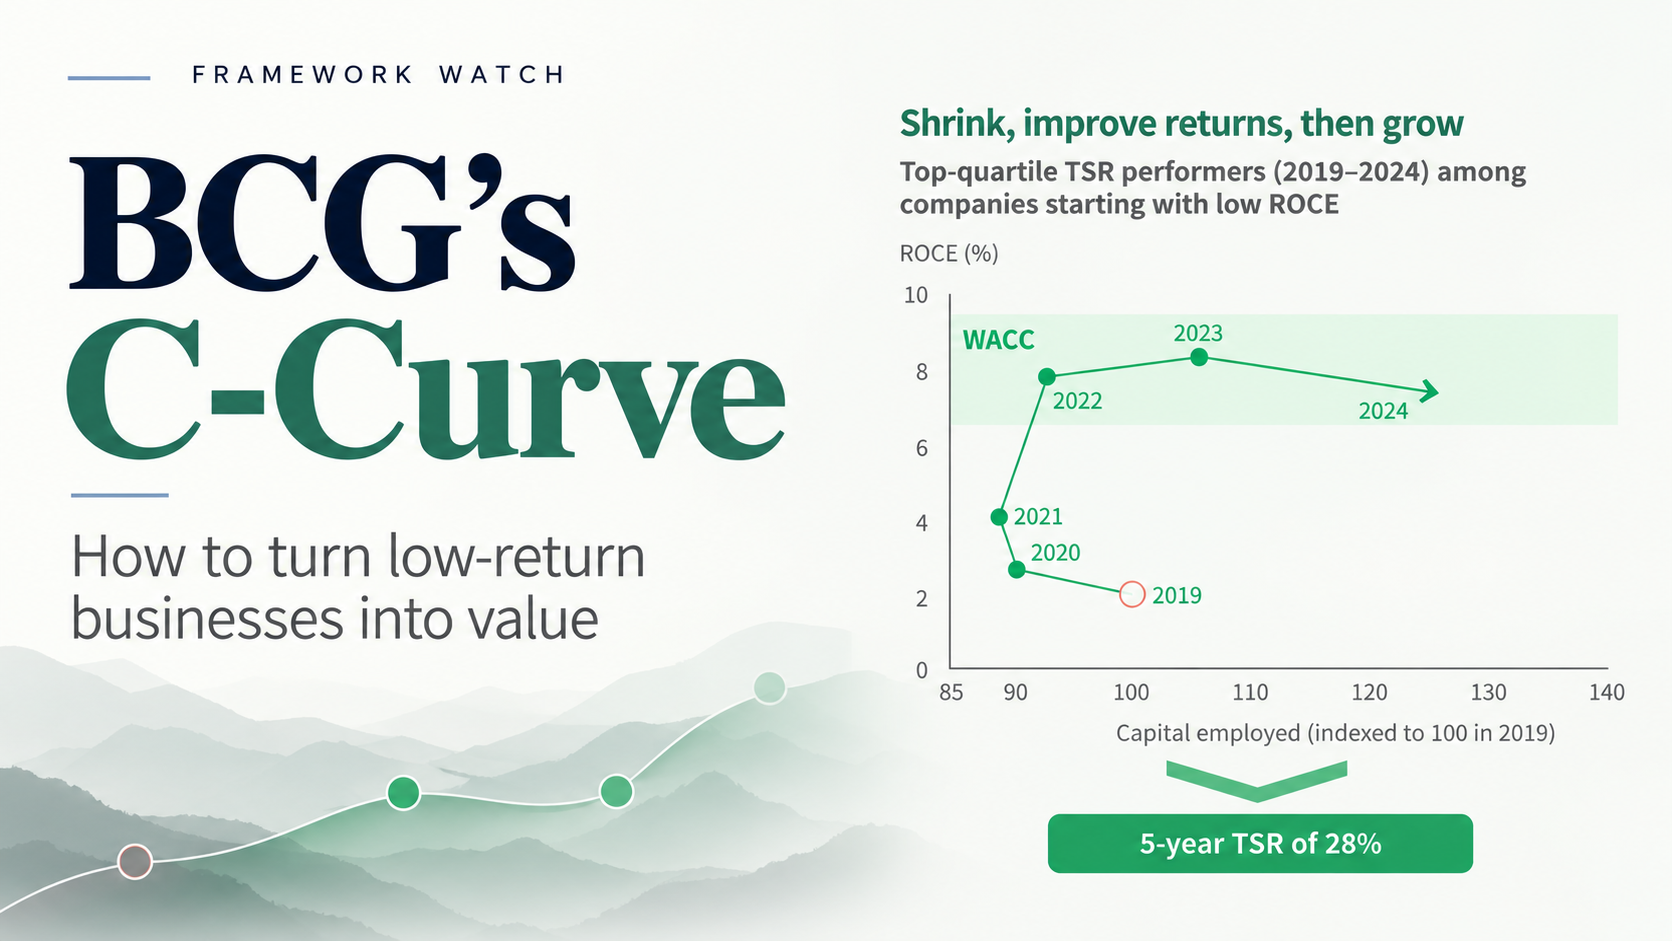
This exhibit is where the name comes from, which the text above does not explain. Plotting ROCE against capital employed indexed to 2019 makes the top-quartile path trace a backwards C: capital employed falls to about 90, returns climb into the WACC band, then capital employed grows again past 120. It also supplies the comparison the article’s text leaves implicit, with the flat-trajectory group reaching a 5-year TSR of 2% against 28%. Read it as the average path of two groups sorted by outcome, not as two strategies tested against each other.
The company illustrations are anonymised and used as narrative rather than measured cases, including a compression services provider, a specialty materials company, a distributor, a gas pipeline operator and one unnamed TSR winner. They demonstrate that the moves are possible, not that they are typical. The prevalence claim that persistently low returns affect about one in seven companies globally is stated without a cited source or dataset, and sits outside the S&P 1500 universe that was actually analysed, so it needs verification before anyone repeats it.
One further constraint on replicability: the exclusion of businesses experiencing temporary downturns caused by normal cyclical fluctuations requires a subjective judgement about what counts as temporary or normal, and no rule is given. The 668 and 60 figures therefore depend on calls that cannot be reproduced from the published method.
4. Where it helps
The sequencing discipline is the strongest practical contribution. Pushing growth capital into a business that has not yet established where it holds advantage increases the capital base before the returns can support it, and the arithmetic of ROCE makes that visible straight away. Framing the problem as an order of operations rather than a list of priorities is genuinely useful in a capital committee, because it forces a choice instead of allowing a growth plan and a margin plan to be approved side by side.
It is also useful as a challenge to turnaround optimism. Chronically low-return units tend to produce plans that assume better returns from better execution, with the same portfolio, the same customers and the same footprint. Inertia is the default condition in businesses like this, and a plan that changes nothing structural is usually a forecast of inertia with a better slide. Asking what has to change in scope before the numbers can change is a cheap and effective test.
The third contribution is the metric shift. Orienting a low-return unit around cash flow, returns and disciplined capital allocation rather than P&L growth changes which options look attractive, and the source gives concrete illustrations of what that looks like in practice: exiting whole segments of products, customers and geographies, consolidating five facilities into one scaled, low-cost facility funded by the working capital released, and deploying a fleet reduced by 20% only to the most profitable customers. Those moves are specific enough to adapt, which is more than most strategy frameworks offer.
5. Where it misleads
The causal framing is the main problem. The statement that in most instances, failing to follow the C-curve will result in weak or even negative value creation is a probabilistic prescription about companies outside the sample, and the design has no counterfactual that could support it. The article’s softer phrasing elsewhere, that such companies tended to generate little, if any, value, is the claim the evidence actually earns. The extension that the C-curve applies to all companies and executives, not just those with persistently low enterprise returns, stretches a finding from 60 US-listed companies screened at below 4% ROCE to everyone.
Sector and cycle confounding is unaddressed. The illustrations include a compression services provider that owns its equipment fleet and an operator of gas pipelines, and the measurement window runs from end-2019 to end-2024, a period containing a pandemic drawdown and a sharp energy recovery. Without the sector composition of the 60 companies, the 28% figure cannot be separated from commodity exposure. This is not a reason to reject the framework, but it is a reason not to treat the number as an expected return.
There is also a mechanical point the ROCE definition makes unavoidable. Shrinking the capital base raises ROCE through the denominator whether or not competitive position improved. Returns improved and the business got better are two different claims, and a framework that measures the first can be satisfied without achieving the second.
The most consequential misreading risk is capital returns being mistaken for operating improvement. In one TSR winner, returning cash to shareholders drove 19 points of TSR from 2019 through 2024, against 1 point of TSR through cash flow for the average company. For that company, a large part of the result is deleveraging and buybacks on a depressed multiple. Read carelessly, the C-curve becomes a licence to cut capital spending and repurchase shares in a business that needed repositioning instead. The diagnostic questions BCG offers for executives are presented as practice guidance and are not tested against outcomes anywhere in the analysis, so they should be treated as prompts rather than as validated screens.
6. Scorecard
| Dimension | Score | Rationale |
|---|---|---|
| Clarity | 8/10 | Three named steps in a fixed order (shrink the capital base, improve margins, then grow) plus a graphical exhibit make it easy to repeat in a portfolio review. The main ambiguity is what counts as “sufficient granularity” when identifying low-return businesses, which the source leaves to judgement. |
| Novelty | 4/10 | The source itself calls it “a new empirical framing of a corporate-strategy tenet that BCG has long championed: build advantage, increase returns, and pursue growth — in that order”, so the novelty is in the dataset rather than the logic. The underlying ideas are familiar from value-based management (earning above the cost of capital), portfolio pruning and divestment logic, and the fix-then-grow sequencing of the restructuring literature. |
| Evidence base | 4/10 | There is real data work: more than 2,300 S&P 1500 companies over 2014 to 2024, narrowed by disclosed exclusions to 668, screened at below 4% ROCE to give 60 companies, with TSR measured from 31 December 2019 to 31 December 2024. But the underlying data in Exhibits 1 and 2 is not reproduced, the size of the “C-curve travellers” group behind the 28% figure is not disclosed, the company illustrations are anonymised narrative rather than measured cases, and the “about one in seven companies globally” prevalence claim has no cited source and sits outside the S&P 1500 universe analysed. |
| Causal strength | 4/10 | Observational and retrospective, with no control group, no matching and no counterfactual, and the three-step pattern was identified by first picking the TSR winners within the 60, which is selection on the dependent variable. The 2019 to 2024 window and energy-exposed illustrations (a compression services provider, a gas pipeline operator) leave sector and commodity cycle as unaddressed alternative explanations, and shrinking the capital base raises ROCE through the denominator whether or not competitive position improved. |
| Decision usefulness | 7/10 | It changes a real allocation decision: whether to fund growth in a chronically low-return unit now or require it to shrink to a provable core first, and it shifts the governing metric from P&L growth to cash returns, which changes which options look attractive. The diagnostic challenge to any turnaround plan that forecasts better returns without a change in scope is a cheap governance test, even though the diagnostic questions themselves are offered as practice guidance and are not validated against outcomes. |
| Practicality | 7/10 | The operational moves are concrete enough to copy: exiting segments and cutting a fleet by 20% while shifting toward more profitable large equipment, consolidating five facilities into one funded by the working capital released, repricing around the most attractive customer segment. The constraint is that it needs granular return data below the segment level and the authority to shrink a business, which not every executive reading it has. |
| Risk of misuse | 7/10 | High risk, mostly because the framework can be read as licence to underinvest: in one winner, returning cash to shareholders drove 19 points of TSR from 2019 through 2024 against 1 point for the average company, which is largely a capital-returns and deleveraging effect on a depressed multiple rather than evidence of operating improvement. The source’s own overreach compounds this, with “in most instances, failing to follow the C-curve will result in weak or even negative value creation” and the claim that it “applies to all companies and executives”, and the 28% figure invites use as a forecast rather than as motivation to ask better questions. |
| Overall usefulness | 6/10 | The decision it improves is real and the sequencing discipline is sound, and the strongest finding (similar average five-year TSR and similar odds of top-quartile TSR from very different starting ROCE positions) is credible because it follows from starting position already being priced in. But the C-curve itself rests on 60 screened companies with winners chosen by outcome, so treat it as a portfolio diagnostic and a prompt for harder capital-allocation questions, not as a demonstrated recipe, and keep the shrink decision tied to evidence of where advantage actually sits rather than to the arithmetic of a smaller denominator. |
Risk of misuse: a higher score means higher risk.
The overall score of 6 reflects a genuine split between the decision value and the proof. Clarity and practicality score well because the sequence is easy to repeat and the operational moves are concrete. Evidence base and causal strength score poorly for the same underlying reason: the pattern was found by looking at the winners, the sample is 60 companies, the exhibit data is not shown, and the window and sector mix leave obvious alternative explanations open. Novelty is low by BCG’s own account, since the article presents itself as a new empirical framing of an existing tenet. The risk-of-misuse score is the one to watch, because the framework’s failure mode is attractive to management teams: cutting capital and returning cash is easier than working out where advantage actually sits. A 6 means use it, and do not cite the 28%.
7. Practical use case
A diversified industrial group is running its annual portfolio review. One division has earned below its cost of capital for five consecutive years and is requesting capital for capacity expansion, on the argument that scale will fix the margin problem.
Using the C-curve as the structure for that review produces four concrete steps. Segment the division below the reporting level, by product line, customer and geography, because a division-level ROCE of 3% usually conceals a profitable core and a set of loss-making tails. Set objectives for this division that differ from the group’s high-return divisions, anchored on cash flow and return on capital employed rather than revenue or EBITDA growth. Require management to present a shrink-to-core option alongside the growth case, specifying which segments would be exited and what capital and working capital would be released. Then test the growth plan against the source’s own diagnostic: if returns are forecast to improve without a meaningful change in scope, ask what the confidence rests on, given the division has had five years to deliver that improvement already.
The decision the framework changes is the order of spend. Fix and prove the returns of the smaller core first, fund that work where possible from capital released by consolidation, and hold the growth capital until the core clears the cost of capital. If the core cannot be identified, that is itself the finding, and the honest option is divestment rather than a smaller version of the same problem.
Two guardrails for the manager. Require evidence of where the division holds a real cost or customer advantage before approving the shrink, because a higher ROCE achieved purely by removing capital is an accounting outcome, not a competitive one. And separate the operating case from the financing case, so that reduced capital spending and share buybacks are evaluated on their own merits rather than counted as proof that the strategy worked.
Source. C-Curve: Strategic Framework for Low-Return Businesses | BCG, Boston Consulting Group.